Though the upgrades and modifications have worked quite well I felt there was still room for improvement but with no quantitative measurements being taken during the upgrades you start to fool yourself with how those changes are actually performing.
A good indication of receiver performance is to measure the noise figure, the Anglian 3L has a quoted noise figure of between 1.6 - 1.8 dB whereas the FT991’s noise figure is 5 dB at two metres, so how do we go about doing measuring this for ourselves?
Caveat : I’m not going to talk too much about what is a Y factor measurement or about noise figures in general there are two excellent documents from Keysight that explain both in far more detail than I could do justice, these two documents are called “Fundamentals of RF and Microwave Noise Figure”2 and “Noise Figure Measurement Accuracy: The Y-Factor Method”3.
So what does the noise figure represent? Well the noise figure is a measurement of the degradation of the Signal to Noise Ratio introduced into the signal chain by the devices which make up the chain, a lower figure indicates better performance.
To measure the noise figure of a receiver you require two pieces of equipment a calibrated noise source and a means of taking the measurement.
A good quality calibrated noise source from Ailgent would cost you hundreds of pounds even for a second hand one which is out of reach of most amateurs.
There is an alternative however available in the guise of the RXGen noise source from RFDesign4, also available from the same company are the RFD2305 ENR 5dB +/- 0.25dB and the RFD2315 ENR 15dB +/- 0.25dB precision noise sources available for around twice the cost.
The RXGen is a 2MHz - 2.4GHz noise source with a measured ENR (Excess Noise Ratio) of 10dB +/- 0.5dB which costs seventy eight pounds including postage.
This means you can take measurements with an accuracy of +/- 0.5dB. We will also need someway of measuring the noise figure but again a good quality noise figure meter such as the HP 8970 PANFI is likely to set you back hundreds of pounds second hand.
We can however use simpler equipment but with the proviso we accept we’ll not be able to measure noise figures below 2dB with any certainty.
A ‘Y’ factor measurement is defined as the ratio between thermal noise, defined as 290k for a 50ohm calibrated load at an ambient temperature of 17 deg C, and the noise source when switched on, we can make the measurement as a simple voltage ratio or the difference between the two measurements in measured in decibels.
It’s worth mentioning temperature can have a profound affect on the measured noise figure this especially comes in to play for low noise figures.
There are a number of ways of taking the measurement the simplest being to use a digital voltmeter, the accuracy of using this method will be dependant on the quality of the meter employed, I used a cheap UNI-T meter and obtained good results despite the meter not being a true RMS model.
The second method uses a PC’s sound card with either SpectraVue5 in continuum mode or an excellent piece of software called NFM from Owen Duffy VK2OMD6.
So let's try to measure the NF of a Icom 7300 on the 10m band with pre-amp one switched on.
To measure the noise figure we first need to connect a calibrated 50ohm load to antenna socket.
The RXGen will act as a 50ohm load when unpowered, technically we should use a calibrated 50ohm load but I’ve found the difference in measured noise figure is smaller than the indicated accuracy of measurement available and as such the RXGen is a perfectly adequate.
Before taking the measurement ensure the radio’s AGC is set to off otherwise set it to its slowest available setting.
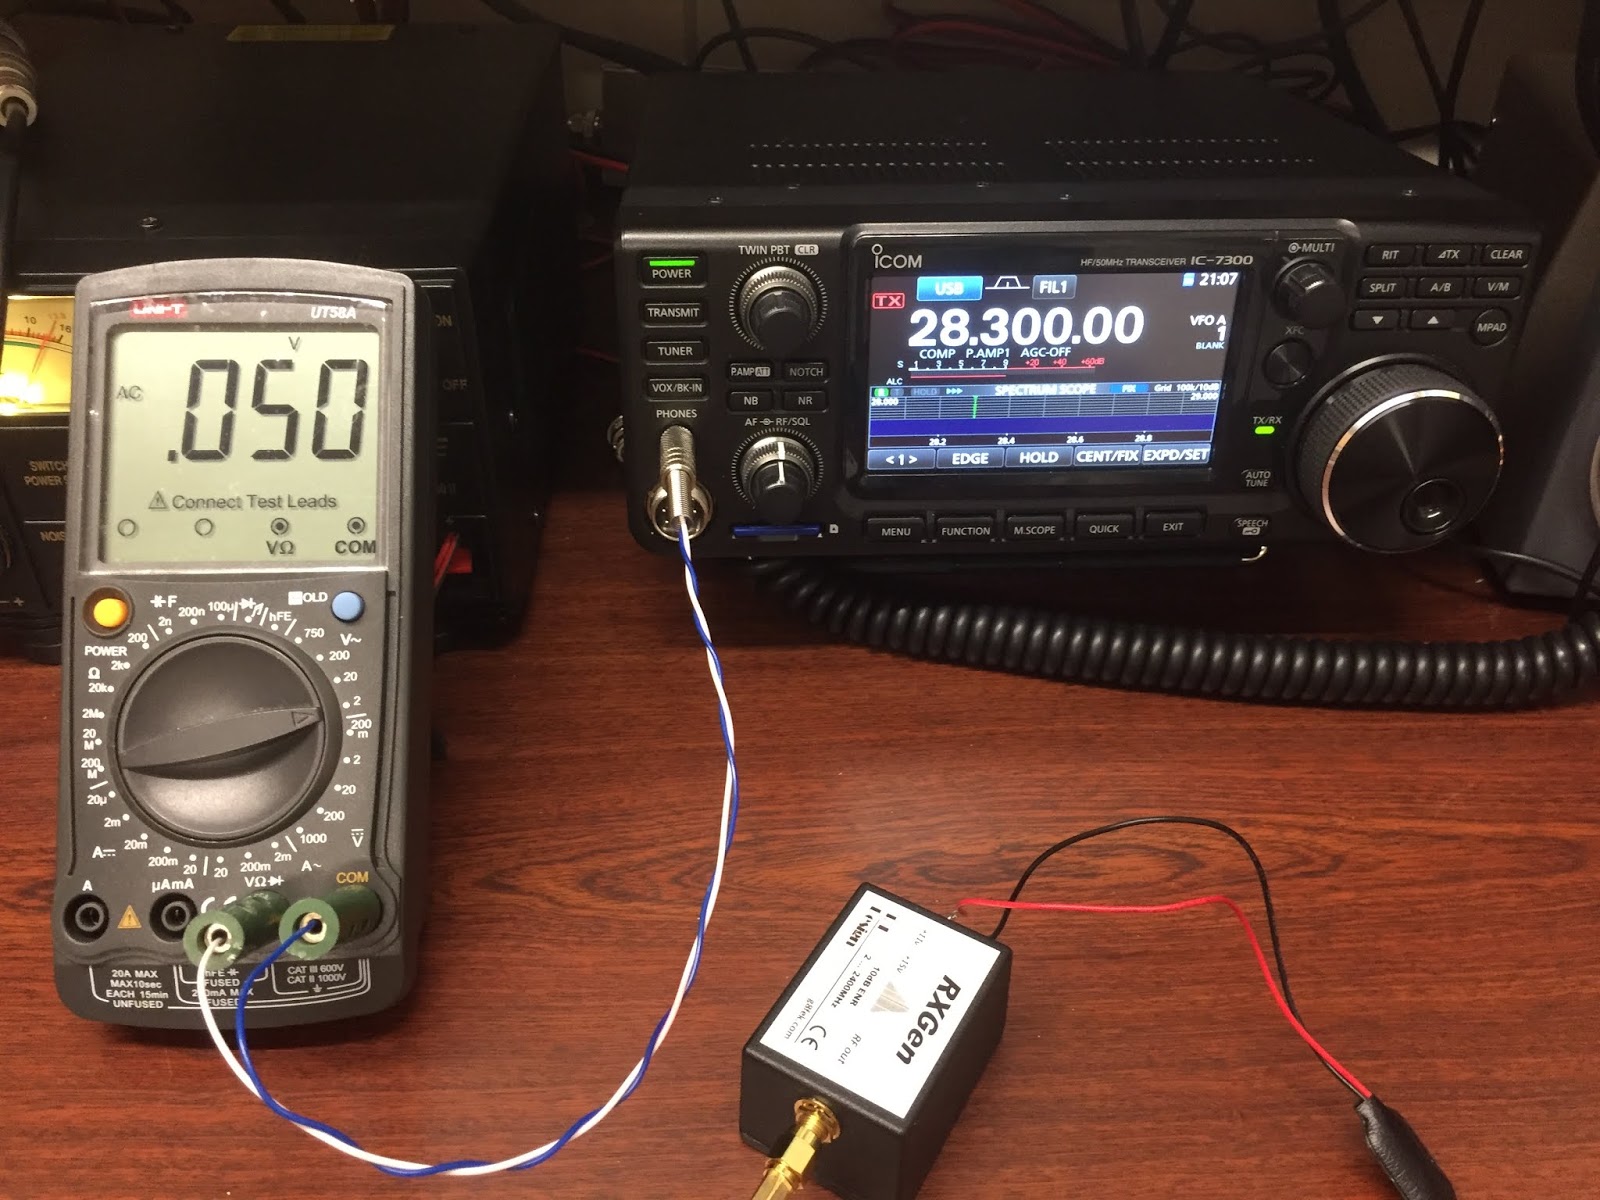
Next we need to connect the headphone or speaker output to the DVM, I used a 3.5mm stereo jack to a couple of banana plugs to connect the DVM via the IC7300 headphone socket.
With the load connected set the radio’s audio gain for a quiescent value of say 50mV.
You can see in the following image the meter reads 50mV in reality the meter will vary by a few millivolts either way so I tend to watch the meter for a few seconds and take the lowest value.
 |
| Meter reading noise source switched off. |
Next we apply power to the RXGen and read the lowest active value in this case 90mV.
 |
| Meter reading noise source switched on. |
To find the Y factor we need to find the ratio between the quiescent and active values, 90 / 50 = 1.8, we can then use the chart supplied with the RXGen to find the noise figure for the given voltage ratio.
Note you can calculate this by hand using the formulae given in the Keysight documents but with the level of accuracy available with the RXGen the chart method is perfectly adequate.
 |
| Measured NF using Voltage ratio method. |
Reading from the above chart the measured noise figure is approximately 6.3dB, which is near to the figure quoted by Icom for the IC7300 of 7.12dB for the 10m band with the first pre-amp switched on.
When taking measurements with a DVM I would advise you take more than one reading and take the average however I found even if you do this unless, you have a true RMS meter, the result can be off by +/- 1dB.
A more accurate way to measure the Y factor is to use SpectraVue, you will need to connect the device to be tested via either its headphone or speaker output to the computers sound card, this can lead to ground loops so it would be best to use a sound card such as the Signalink to carryout any measurement or use a 1:1 isolation transformer.
The IC7300 has a built in sound card so I will use that to carry out the measurement, however this will mean the noise figure of the sound card will also be included in the measurement.
You can see in the image below SpectraVue is running in continuum mode with FTT averaging and smoothing applied, indicated by the red arrows, with the load connected SpectraVue gives a quiescent value of -83.35dB circled in red.
 |
| SpectraVue quiescent measurement. |
 |
| SpectraVue active measurement. |
Again using the documentation that comes with the RXGen we can read off the chart to obtain a NF reading of 7dB as shown below.
 |
| Y Factor measurement using dB method. |
The last method utilises a piece of software called NFM from Owen Duffy VK2OMD the software is restricted by default to an integration interval of 0.5s you can however request a licence from Owen if you want to use a long interval, you can find his email address on qrz.com he’ll email you a licence for free eventually.
When using NFM you must enter the noise source’s specified ENR specified in the case of the RXGen 10dB as depicted in the below image.
To obtain a reading set the sound card you are using as the default device for the system otherwise NFM will not use it.
With the noise source switched off press the ‘1 Noise LO’ button indicated by the red ‘A’ once a quiescent value has been found apply power to the RXGen and press the ‘2 Noise HI’ button indicated the by the red letter ‘B’ after a moment the calculated noise figure will be displayed as circled in red.
NFM will indicate if the sound cards level is either too high or low by displaying a line of red asterisks, in this case just adjust the level to a suitable value using the gain controls for the device being used.
 |
| NFM noise figure measurement. |
I have also included below an image of NFM doing the same measurement but with a longer integration interval of 30s and you see the noise figure has only changed by 0.2dB this indicates the longer integration interval isn’t of any real use when using the RXGen noise source.
 |
| NFM extended integration time. |
In the following example the equipment is set up in the following manner which is my default operating configuration.
NOTE : Normally you wouldn’t have any additional attenuation in the signal path when taking a two stage measurement it’s only included here because of the difficulty I have in reconfiguring my equipment.
 |
| System configuration for two stage measurement. |
Next we add the Anglian 3L, 3dB splitter and 20dB attenuator in to the signal path.
Now find the quiescent state value by pressing the button labeled C.
For a two stage measurement you must include any attenuation between devices otherwise the measurement will either not work or be inaccurate, so we enter the total value of any attenuation in the box labeled D.
Lastly we find the active state value by powering on the RXgen again and pressing the button labeled E this yields a total noise figure for the system of 6.48dB again circled in blue.
You may ask yourself why is the noise figure so high if the Anglian has a stated noise figure of 1.9dB? The reason for this is the attenuation introduced by the splitter and attenuator negates any additional gain the Anglian has provided and therefore resulting in a noise figure is more or less in line with the specified noise figure for the IC7300.
However since we’ve done a two stage measurement we can find the noise figure and RX gain of the Anglian by looking at the device under test section of NFM where we can see we have an RX gain of 25dB and a noise figure of 2.5dB both circled in red.
This is in good agreement with the Anglian’s quoted specification of an RX gain of 25dB and noise figure of 1.9dB.
 |
| NFM two stage measurement. |
I hope this short article has encouraged you start experimenting with taking noise figure measurements with a simple low cost noise source it can lead to hours of fun discovering where or where not your system is performing as expected.
- http://www.g4ddk.com
- http://literature.cdn.keysight.com/litweb/pdf/5952-8255E.pdf
- http://literature.cdn.keysight.com/litweb/pdf/5952-3706E.pdf
- http://g8fek.com/noise-gen.html
- http://www.moetronix.com/spectravue.htm
- https://owenduffy.net/software/nfm/index.htm
This article was first published in the March 2019 edition of QUA the new letter of the Cray Valley Radio Society.